
Knowledge of the contents in these mini lectures is not necessary for
passing this class, i.e. your performance and grade is unaffected by most
of these mini lectures (some may be assigned, e.g. #5 to
prepare for the Quiz 20 Pretty Pictures). Most of this is
supplementary material for people who want to get beyond of what this course
requires.
This mini lecture is FYI, something to share at the dinner table. It won't appear on any tests or quizzes.
Calendar
Originally cultures used lunar calendars - why? A. Mankind started out in more tropical regions in the world where the change of seasons is not very apparent. Instead its easy to monitor our Moons phases.
Then there was the solar calendar - why? A. For agricultural purposes, they did need to know what to sow and when to harvest which does in fact depend on the seasons but not(!) on our Moons phases.
Reconciling lunar and solar calendars was not an easy feat because the year has 365 days. A lunar month on the other hand has 29.5 days, so that 12 months make 355 days. The solutions were to put another 10 days at the end of a year or another month every 3 years.What were the original reasons for keeping an accurate calendar? A. For keeping religious feasts at proper times, for agriculture (when to sow and when to harvest), economic (when taxes are due; how much interest to charge).
Our calendar is based on the Julian calendar which developed from the Roman lunar and the Egyptian solar calendar.
Interesting and puzzling questions linked to the development of the calendar:
Q. Why are there 12 months in a year? A. see above.
Q. Why is September (septem - 7) the 9th, October (remember Octagon) the 10th, November (novem - 9) the 11th and December (remember decimal, decade) the 12th month? A. The original Roman year had 10 months, starting on March 1, making September really the 7th month etc. Then January and February were added to make it 12 months (February originally was the month of doing your end-of-the-year house cleaning). The calendar was off anyway which upset lots of people (how much do I pay taxes, rent, interest, etc., is somebody cheating me?). So Julius Caesar reformed it: put Jan & Feb at the beginning of the year, make months alternating with 31 and 30 days* (makes 366 days), February would have a leap day every 4 years (normally 29 days, so the year was 366-1=365; but 30 during leap year, making 366; 3 years with 365 days and 1 year with 366 days makes an average of 365.25 days - correct!). To honor Caesar, the Roman Senate named Quintili (the month after June) July. *31 days: Jan, Mar, May, July, Sep, Nov; 30 days: Feb (29/30), April, June, Sextili, Oct, Dec.
Q. Why are there roughly 4 weeks in a month and 7 days in a week? A. For astronomical reasons (about 7 days between our Moon's major phases, i.e. new, first quarter, full, third quarter), but also for the convenience of choosing mystical numbers. Also, there are 7 ancient "planets" (Moon, Mercury, Venus, Sun, Mars, Jupiter, Saturn). Then again, other sources say that there are no astronomical reasons for the 7 days.
Q. Where do the names for the days of the week come from? A. From the planet names: in English Saturday, Sunday, Monday, in French, Italian and Spanish you also have Mardi, Mercredi, Jeudi, and Vendredi, while in English and German the other days were named after Celtic pagan gods. Check Western Washington University.
Q. Why are the lengths of the month so non uniform? A. After Caesars death, they screwed up the calendar again: instead of having a leap year every 4 years, the Romans had it every 3 years, therefore accumulating too many days. So emperor Augustus readjusted the calendar by skipping the leap days between 4 B.C. and 8 A.D. (of course "before Christ" and "anno Domini" were introduced much later; instead they used emperors inaugurations and Olympic games as year markers). He was honored by having Sextili (the month after July) renamed August. But now get this: August had originally 30 days, but Augustus was deemed as important as Caesar, so he got another day (taken away from Feb, which made that into 28/29), and now the "logic" goes that September had 31 days, making 3 months in a row with 31 days (upsetting for people paying interest, etc.), so Sep, Oct, Nov, Dec got their number of days switched. So thats the way its now.
Q. Why is there a leap day every 4 years? A. The Earth needs 365.25 days to orbit our Sun. Its easier to add another day every 4 years than 6 hours every year - hey, how about it: have 6 more hours of New Years day.
The development of the calendar is ultimately linked to how to measure time accurately. The most accurate measurement for the solar year is 365.2422 days. The use of the lunar calendar for important purposes was abandoned more than a thousand years ago.
The world is now using the Gregorian calendar for commerce, politics, science, which is a slightly reformed form of the Julian calendar. Whereas the Julian calendar has a leap day every 4 years (based on the erroneous 365.25 day year, which for practical purposes is a very good value though), making a total 100 leap days within 4 centuries, the Gregorian skips 3 leap days within 400 years because the difference of .0078 times 400 makes 3 days that the Julian over accounted for. However, many cultures are using their own calendars which are linked to their own religions.
Q. Why is that important? A. the answer was linked to the Christians' most important holy day: Easter. And to some extent to agriculture.
The Julian and the Gregorian calendars are off by 13 days now, which is why the Orthodox church in Russia celebrates New Year on (the Western world's) January 13 since it does not follow the Gregorian.
Link: University
of Tennessee.
Mini Lecture B - Seasons
Watch the video I made about the seasons, "Gravitation & Motions",
its in the WNCC Alliance, Sidney, and Scottsbluff libraries. Read
through my lecture Gravitation and Motion, check the animations on my Planet
lecture (they're big, so long download time).
To accompany Lab
B2 Seasons
My phony theory on seasons:
Our Sun orbits the Earth. Earth's axis is tilted. Throughout the year (365 sun orbits around the Earth) the Earth's axis swings slowly towards our Sun (spring -> summer), then swings away (fall -> winter).
This in fact explains the observations of different sun heights and the different times of rise and set of our Sun.
The major problem is that the Earth's axis would have to swing through
an angle of 47 degrees (2x23.5 axis tilt) and there is no reason why it
should do that, i.e. there is no force present that would make Earth do
that.
So heres the correct theory:
Instead we might as well have Earth permanently tilted in space (pointing at Polaris), have it rotate on its axis (day-night). And as Earth goes around the Sun, Earth's axis, which is fixed relative to the stars, pointing to Polaris, gets tilted away and toward **relative to our Sun**. THIS, OF COURSE, IS THE CORRECT THEORY. It's correct because it explains all observations and needs only the correctness of the gravitational law (making Earth orbit our Sun) and that Earth spins indefinitely on its axis. The latter makes sense because "something in motion will tend to stay in motion" as long as no force changes its motion (Newton's principle of inertia). So something spinning will keep spinning (there is no force that slows earth down considerably).
I leave that up to you to come up with a theory explaining the seasons.
You will however notice that any other than the above correct one will
have some flaw.
Mini-lecture C - Eclipses
The following is not terribly important. If something from your reading assignments confuses you, send me private mail and I'll answer it.
C.G. Wallace asked the following (from HW#3):
>7. a. An eclipse occurs when sunlight is blocked either
by the moon to the earth
>or the earth to the moon. b. Apparently thats how
often orbital planes of the moon
>and the earth cross each other when there is a full or new moon.
But explain statement
>in text on (Pasachoff, p. 105; Arny p.199),
first paragraph, "up to seven times a year".
Lunar eclipse and solar eclipse go together (14 days apart), makes two. You talk about "orbital planes [..] cross each other", which they do twice (we call them "nodes"). So this happens twice during one Earth orbit (one year), makes 2x2=4. Now two more things: i) as the moon orbits during "eclipse month", it's close to its sun-ward node -> solar eclipse, 14 days later its close to the sun-away node -> lunar eclipse, AND it can happen that the sun-ward node is still approximately between Sun and Earth, i.e. a **third** eclipse (again solar). This makes for a fifth eclipse in that year. (Most likely both solar ones are only partial.) ii) "Remember precession? The moon's orbit slowly precesses, thus turns westward by about 19.4 degrees per year. After 18.6 years the line of nodes has returned to its previous orientation. A yearly consequence of this precession is that eclipse seasons begin about 19 days earlier each succeeding year." (from King's University) So if you have eclipses in early January, (the next batch in June/July), you get the last eclipses in late December. If one eclipse season is a triple, it will make for 7 eclipses in a calendar year.
If you give me little time, I could figure out when that will happen
again. I did find a little time: in 2038 there are four penumbral
lunar eclipses on January 21, June 17, July 16, and December 11, and three
solar eclipses on January 5 (annular - between South America and Africa),
July 2 (annular - Northern Africa), and December 26 (total - in Australia).
Brian Brink writes:
>Another fact, the Moon is steadily receding from the Earth.
> Overtime, the faster rotation of the Earth has caused, via
>energy transfer, the Moon's orbital speed to accelerate.
>As the orbital speed of the Moon accelerates, the Earth's
>rotation has in turn slowed. Therefore, per Kepler, this
>would mean that as the Moon's orbital speed increases, its
>distance from the Earth would also increase. (The faster
>the orbit the greater the distance). The Moon is receding
>about 4 cm a year. What does this have to do with
>eclipses? Someday, maybe in a few million years, the
Moon
>will be too far away to participate in an eclipse.
But
>for now, we can enjoy this cosmic dance between the Sun, Earth,
and Moon.
I read somewhere else that it's a few 100 million years until we won't have total eclipses anymore.
The whole thing on eclipses is really interesting because it's complicated yet understandable by the layperson, just get through the terminology of opposition, conjunction, node, eccentricity, inclination, perigee, apogee, precession of nodes, Saros.
Really, it's not that hard:
opposition: M-E-S, Moon opposite Sun for example.
conjunction: E-M-S, Moon in same direction as Sun for example.
node: where two orbits cross. eccentricity: how elliptical an orbit
is (e=0 means circle, e=0.248 for Pluto means very
elliptical).
inclination: by how much one orbit is tilted to another, e.g. Moon's
is tilted by 5 degrees.
perigee: Moon's closest point to Earth; perihelion: Earth's closest
point to Sun; perijove: an object's closest point to Jupiter.
apogee: Moon's farthest point from Earth; aphelion: Earth's farthest
point from Sun; apojove: an object's farthest point from Jupiter.
precession of nodes: due to the various gravitational forces in
our mini system of earth, moon, sun, our Moon's orbit changes by shifting
its perigee by 19.9 degrees every year, getting it back to the start after
18 years - important for eclipse predictions.
Saros: 18 year cycle between eclipses that are of similar appearance.
Literature:
Philip S. Harrington: Eclipse!, 1997
Bryan Brewer: Eclipse, 1991
Fred Espenak's Eclipse Bulletins
... and many, many more.
Mini-lecture D - Eclipses on Mars?
Wade Kniss writes:
>The question I have is this: Would
>solar eclipses on Mars be as spectacular as they are on the
>earth? I ask this because since Phobos and Deimos are
>smaller than the moon, would they be able to block out the
>entire sun, or would they be the same because Mars is that
>much further from the sun that the two variables balance
>each other. Also, since there are 2 moons orbiting Mars,
>does that double the eclipse opportunities or are they
>affected by the angle of their orbital planes?
The question is easy to answer: compare the ratio of true sizes of moon and Sun to the ratio of distances. In our case our Sun is 400 times larger than our Moon and, on the average, 396 times further. Thus we have solar eclipses because the two ratios being equal means that Sun and Moon have the same angular size in our sky.
Since both Moon and Earth orbits are elliptical, the average distance ratio of 396 derives from a minimum ratio of distances of 369 (winter when we are closest to Sun AND if Moon orbit's apogee is at new moon AND coincides with a node = angular eclipse; compare Brian's contributions) and a maximum of 425 (summer when we are farthest to Sun AND if moon orbit's perigee is at new moon AND coincides with a node = very long total eclipse; e.g. July 11, 1991 in Hawaii & Mexico and July 22, 2009 in India & China, each a whopping 6 minutes long - the 18 year Saros cycle that Brian hinted at).
For both calculations, eclipses in general and max./min. eclipses in particular, I just used appropriate numbers in the appendix of your book. To answer your question yourself, look up distance Sun-Mars, distance Mars-Phobos/Deimos (minus Mars radius since Val Kilmer and Gary Sinise are standing on the surface) -> ratio; then look up sizes of Sun and Mars -> ratio. Now compare.
I took the incredible image on the left last September while I was on
a secret mission aboard the Mars
Polar Lander. Contrary to many newspaper accounts I was able
to land the craft safely, unfortunately though not at the pole but fairly
close to the equator. As it turns out, one of my most impressive
vistas was this annular eclipse of Phobos, Mars' largest and closest moon.
I timed the contacts as follows: 1st at 13:26:22, 2nd at 13:26:36, 3rd
at 13:26:48, and 4th at 13:27:02. One notices that the eclipse is
very short, due to Phobos' fast orbital speed (it has a 7h
39m period). Total eclipses are not possible: the eccentricity
of Phobos' orbit is small (e=0.015) and the moon was close to its perimartes
anyway.
After my investigations at this location, I trekked about 550 miles
due north where I established the colony "Hotzenplotz" in reference to
my adopted home town back on Earth which lies at the same longitude and
latitude. (The colony is temporarily vacant.) Upon
returning to Earth I used the software Redshift 3 to produce the
image on the right, and noticed, low and behold, that there will be an
eclipse at this location coming up soon, this time with Phobos being near
its apomartes. (the contact times will be: 1st at 15:07:35, 2nd at
15:07:47, 3rd at 15:08:09, and 4th at 15:08:21.)
Literature: The Adventures of Baron Münchhausen
For photos of a real Phobos eclipse, see Sky & Telescope, February
2000, p.17, and the Mars
Global Surveyor web site.
 View
of the shadow of Phobos (elliptical feature at center of each frame) as
it was cast upon western Xanthe Terra on August 26, 1999, at about 2 p.m.
local time on Mars. The image covers an area roughly 250 kilometers (155
miles) across. The meandering Nanedi Valles is visible in the lower right
corner of the scene. Note the dark spots on three crater floors, which
are probably small fields of dark sand dunes. (c) JPL / NASA /
Malin Space Science Systems
View
of the shadow of Phobos (elliptical feature at center of each frame) as
it was cast upon western Xanthe Terra on August 26, 1999, at about 2 p.m.
local time on Mars. The image covers an area roughly 250 kilometers (155
miles) across. The meandering Nanedi Valles is visible in the lower right
corner of the scene. Note the dark spots on three crater floors, which
are probably small fields of dark sand dunes. (c) JPL / NASA /
Malin Space Science Systems
Mini Lecture E - Retrograde Motion
I guess I should post this analogy:
Imagine that a Ferrari is traveling down I-80 on the right lane at 40 mph. You're in your Landrover on the left lane with 60 mph, about to pass this slowpoke. Focus on this Ferrari (why not?) and you notice that it "seemingly" moves backwards (against the background such as trees or prairie) while you pass it. When you're at an appreciable distance again, the other car will again seem to move forward (as it did the entire time anyway).
Exactly the same thing happens when we (on fast Earth at 19 miles-per-second!) pass Mars (at 15 mps) or Jupiter (at 8 mps), etc., which are moving forward all the time. But as we pass them, they seem to move backwards (against the background of the stars) for a while - retrograde motion.
Check out this cool animation from the University
of Tennessee, click on the Retrograde motion applet.
Mini Lecture F - Resonance orbits
Resonance of Asteroid orbits (Kirkwood gaps) and resonance of Jupiter's moons Io, Europa, and Ganymede
On Tue, Oct. 12, 1999, 12:16, Carle Mock writes:
>Dear Mr. Veh, Why does the gravitational attraction
between some bodies force them into orbital resonance, but asteroids are
kept out of those orbits where they would be in resonance with Jupiter?
Jupiter's moons apparently show orbital resonance. Pluto does, too,
at least in the textbook. Why don't the asteroids orbit where they
would be in resonance, too?
Most asteroids orbit between 1.5 and 3.5 A.U. At around 2.1, 2.5, 2.8, and 3.3 A.U. there are hardly any asteroids. These distances correspond to 1:4, 1:3, 2:5, 1:2 resonances with Jupiter's 11.9 year long orbit.
The asteroids resonance is easy to explain. Personally, I had never thought of trying to explain it, so I just took the researcher's word for it (namely Kirkwood's). In fact, I don't see why there should be a preference for asteroids in resonance orbits. I don't think that these resonance orbits would exist if asteroids and Jupiter would have perfectly circular orbits, in which case the gravitational tug would be the same everywhere (in an orbit; because distance would be the same at any one meeting point), so no preference for any particular orbit. (Apparently, as I read up on this, it happens for asteroids and a giant planet in circular orbits as well.)
So, according to the last note, Jupiter (and the asteroids) don't have to be in elliptical orbits (although rather slightly). But since they are in elliptical orbits, the following discussion should make it clear that there is a periodic gravitational tug changing the asteroid's initial resonant orbit.
Let's take an asteroid in a 1:3 resonance: the asteroid and Jupiter will meet in the same spot every 3 asteroid orbits (one Jupiter orbit) and will be at the **same** distance - and therefore the gravitational tug would be exactly the same! The two meetings in-between will be different, but every third meeting is important. So it experiences an extra tug from Jupiter.
For an asteroid in a non-resonant orbit, it and Jupiter will always
meet at totally different distances, so the gravitational tug will be quite
different and this asteroid would be pulled out, than pushed in, etc.,
so that there will not be a cumulative effect for this non-resonant asteroid.
The Galilean moons Io, Europa, and Ganymede need 1.77, 3.55, and 7.16 days, respectively, to orbit its host planet (Jupiter). These are almost exact 1:2 and 1:4 resonances. Callisto needs 16.7 days, so its not resonant (yet).
I think that since the moons' orbits are fairly close to each other, they exert quite a strong gravitational force on each other when one passes another. Thereby, an inner moon (e.g. Io or Europa) would gain orbital energy from an outer (e.g. Europa or Ganymede), increasing its orbit, decreasing the outer's orbit, until they're in resonance where the gravitational force between these three moons is "balanced" in such a way that they remain in resonance orbits. (Perhaps Jupiters large and the moons mutual tidal forces, also on Jupiter itself, play a role as well, as rotations are slowed down and this rotational energy must become orbital energy.)
I put "balance" in quotes because I'm not sure how to explain this "balancing" gravitational pull.
PS Callisto appears farther out and so it hasn't reached a resonance orbit yet. Give it a few hundreds of millions of years and it probably will.
In conclusion, I would say that there is one large mass (Jupiter) keeping
asteroids out of the resonance orbits, while there are three similar masses
(Io, Europa, Ganymede) putting themselves (each other) in resonance orbits.
Mini Lecture G - Tidal Forces
Gab Gallawa asked the following question in my classroom astronomy class:
When Algol is depicted, only its bulge towards its companion is shown. That's contrary to what we learned about there being a tidal bulge on the other side as well.
I had to think a while about that one until it finally dawned on me.
Part of it is that the facing bulge is more important because if that one is filling out its Roche lobe, material will spill to the other side.
Also, when you read about ocean tides on Earth caused by our Moon, you get a logical explanation of why we have tides on the side nearest our Moon and at the same time farthest from our Moon. Perhaps it's even mentioned that both tides are of (approximately) the same height.
The tidal force is a differential gravitational force. I.e. we are comparing the gravitational force at a point in the ocean with the gravitational force at a neutral point such as the Earth's center.

But for the Algol system, Algol's radius is 2 million km while the
distance to its companion is 10 million km, so k equals only 5. The
above approximation doesn't work for such a small k and we must use the
previously derived equations for near and far side. Plugging in k=5
yields that the near tide is 85% larger than the far tide. So if
Algol's near side has a 20,000 km high tide, the far side has only an 11,000
km high tide. (Actually more interesting would be the
tides on algol's companion since tidal forces are stronger there because
of Algol's larger mass.)
As for ocean tides on Earth, the above approximate equation works well because the accurate equations differ by only 5%. So a 12 feet high tide on the near side would mean an 11 feet 5 inches high tide on the far side.
University
of Tennessee animation.
How is it possible for the giant planets to have rings?
The Roche limit is defined as the distance from a planet or star where this central object's tidal force is stronger than the self-gravity of an orbiting moon (around the planet) or a companion star (around the other star).
Outside the Roche limit tidal forces lead to the deformations described in the previous mini lecture. But inside the Roche limit the deformations would be so extreme that in fact the orbiting object would break apart or that particles could not coalesce gravitationally.
In the case of planets and their moons, the Roche limit is described in terms of this planet's radius. It also depends on the densities of the planet and the moon. Since giant planets and their moons have densities between 1 and 2 (times that of water), usually only the factor appearing in the equation is given. This factor is about 2.5. That means a moon that gets close to ... and closer than ...
Contact binaries ...
Article No. 1060: [Branch from no. 1059] posted by Julene Bithell on
Wed, Sep. 20, 2000, 12:42
Subject: re: Discussion Topic: Moon's Phases
While recording info for Lab B1, I was wondering why the moonrise was only 30 minutes earlier each night instead of closer to an hour. Then, after I had sent my moon phases discussion I read an news article dated September 11, 2000 the Harvest Moon -- arrives this week. (http://spacescience.com/headlines/y2000/ast11sep_2.htm) I thought it might be worth mentioning since I did not know this before! This article explained that throughout the rest of the year the Moon generally rises about 50 minutes later each day. But near the autumnal equinox (Sept 22, 2000), the day-to-day difference in the local time of moonrise is only 30 minutes and occurs shortly after sundown, historically deemed the "harvest moon" so farmers could continue to work into the night.
The average is 50 minutes (=24/29.5) for the moon rising later the following day. But the actual difference varies between 23 and 77 minutes.
If you check http://aa.usno.navy.mil/AA/data/docs/RS_OneYear.html you'll see that this variation happens all the time every day of the year (it's true that for full moons only, 12 or 13 in a year, the shortest time is in September).
I'll give you the reason, but notice that it doesn't matter for any quizzes, HW or midterm/final in this class. I.e. this is just some information because you brought it up.
You need to picture the ecliptic (or zodiac) as arching steeply through the sky (Leo through Pisces) or rather shallow (Aquarius through Virgo), relative to the horizon. Maybe you can envision this path on your starfinder and then imagine how that looks in the sky (e.g. right now, 1 or 2 hours after dusk, Taurus (a "high" zodiac const.) rises in the NW while Sagittarius (a "low" zodiac constellation) sets in the SE).
The ecliptic (or zodiac) is important since that's our Moon's path. Also, notice that I described the zodiac East-West as they appear in the sky since that's our Moon's daily/nightly motion through the sky.
Our Moon travels at about 13 degrees every 24 hours along that ecliptic
(=360/27.3). That's about constant (Kepler 2
doesn't make a whole lot of a difference in making my point).
If our Moon is on a steep part of the ecliptic, a lot of those 13 degrees are vertical motion. Since the times of moonrises are concerned with altitude, you have a longer time in between, i.e. 70 minutes or so.
If our Moon is on a shallow part of the ecliptic, a lot of the 13 degrees motion is in a (day-to-next-day) west-east direction. Thus our Moon will be rising further South (or North, depending) of East, but the vertical didn't change as much. Therefore only 30 minutes.
The whole matter turns out to be not that trivial because we have to envision the motion of an object on a spherical surface. Our brains don't like that, we prefer plain 2-D.
Julene, if you wonder why I used 29.5 for one computation and 27.3 for
the other, I'll make you stay after class ;-)
Mini Lecture 1 - Spectral Type & Surface Temperature
Spectral Type is a quick way of identifying stars. Tell me that Sirius is an A star and I know right away that it's fairly hot (10,000K=20,000F) and white. Tell me that Betelgeuse is an M star and I know that it's very cold (3,000K=6,000F) and it's red.
Spectral type tells us (surface!) temperature: O and B are very hot (more than 15,000K), K and M are very cold (less than 5,000 K).
The color of a star tells us temperature as well: blue (O and B) are hottest and red (K and M) are coldest. You know this from a lighter: the inner bluish flame is hottest, the outer red coldest, the middle yellow part is in between.
PS As you can imagine, it's hard to perceive color, most stars seem to be white. Colors show up better in time exposure photos. But try Arcturus or Betelgeuse (K & M) in the sky: they truly show color! (which color?)
Why are color, surface temperature, and spectral type related to each other? See (Pasachoff p.364; Arny p.356/59), Wien's and Stefan-Boltzmann's laws, "Snow's Universe" web site (Fig. 6.07, 6.08) (Snow's Universe is temporarily offline).
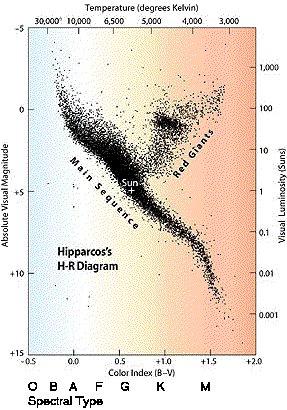
Another one is closely related to these: color index. See (Pasachoff p.366 margin, p.389; Snow). A hotter star (O or B) emits more blue photons than yellow/green photons, its color index B-V is negative. A-stars emit about the same amount of blue and yellow/green photons, so B-V=0. And starting with F-stars, stars are colder and emit more yellow/green than blue photons and B-V is positive. Again, color index gives temperature. See the notation on the HR-diagrams in lab F2.
Confused?
Don't worry, you'll understand more the more you read and go through
my lectures. Youll be amazed by how much we can learn by looking
at a star's spectrum or its color.
Now that I looked at them, yes, they are important - although on a conceptual basis only!
Wien: wavelength-temperature relation or color-temperature relation: smaller peak frequency (more towards blue end) means higher temperature.
Stefan-Boltzmann: temperature-radiated energy relation or (almost) temperature-luminosity relation: higher temperature means more energy radiated (which we call luminosity). Example: my SEA-5 and (Pasachoff p.374; Arny p.367) tell you that Sirius (an A star) is about twice as hot as our Sun (a G star), therefore radiating 16 times more energy. Superhot Spica (B, 30000K) is 5 times hotter than our Sun, therefore emitting 5x5x5x5= about 600 times more energy.
As for luminosity, size is important as well: (check the appendix in my Stellar Evolution lecture) Sirius is 2.5 times in radius. Square this, gives about 6, times the former 16 makes Sirius about 100 times brighter than our Sun. Spica is 7 times in radius. Square this, gives about 50, times the former 600 makes Spica about 30000 times brighter than our Sun.
Both temperature and size together make sense: a hotter body is more luminous. A larger body is more luminous. That's common sense, right? We'll encounter hotter, larger stars (Spica), which are much brighter. We'll encounter -colder-, but +++larger+++ stars (Betelgeuse, a Red Giant), which are also much brighter. We'll encounter +hotter+, but ---smaller--- stars (Sirius B, a White Dwarf, Pasachoff p.444; Arny p.380), which are much fainter. See the Luminosity diagram in my Measuring Stars lecture.
Planck: we don't need that.
Hydrogen lines (Pasachoff p.370-72; Arny p.106-09): understand the gist of the diagram on (Pasachoff p.372; Arny p.107).
"Do we have to calculate a lot with these and other mathematical formulas?"
you will ask. "NO!!!" is my clear answer. HW, quizzes, lecture,
and final are of the same structure as in the first half of the semester:
no need for calculators or calculations. On some of the labs there
may be some computations. But remember, you handled F9 Kepler 3 very
well, further calculations are of the same difficulty (or about as easy).
You find an appendix with 7 tables in my lecture "Stellar Evolution" (abbreviated SEA). Also, appendices (A-5&7 in Pasachoff; Arny App. 8-10) on Brightest and Nearest stars are important.
When you read through lectures, chapters and my messages on the bulletin board, keep all these appendices at hand.
I will not make you memorize those numbers. But I want you to understand the trends they show.
You notice that all tables show the same first two columns: spectral type and mass. Why? Because spectral type is how we classify stars and when you mention a Main Sequence G2 star, I know that it's yellow, has a medium temperature, medium size, burns H into He via the proton-proton chain, lives a few billion years, etc., etc. Mass is very important because EVERYTHING about a star's evolution and structure depends primarily on mass.
Trends mean: Main Sequence O and B are massive, hot, large, bluish, have a short lifetime, are very bright, there are very few of them, etc.
K and M are just the opposites of the above.
When I use sample stars from these tables in my lectures, I try to choose
bright stars that are on your starfinder - so you can look at them at night
- or stars that we come across naturally in the text.
study (Pasachoff, p.427-9, 452-5 (diagram); Arny p.334/35, 396/97, 402/03) and my stellar evolution script.
Low mass MS stars (G to M) fuse nuclei according to the proton-proton chain (cycle), 4p -> He & Energy.
Higher mass MS stars (O to F) fuse nuclei according to the CNO cycle, 4p -> He & Energy (via CNO as a catalyst).
All Red Giants fuse nuclei according to the triple-alpha process, 3He -> C & Energy.
High mass Red Giants (mass > 5-10 solar masses) fuse nuclei via Helium capture all the way to iron.
Check (Pasachoff A-10; SEA-7): the abundance of elements "zigzags" (down-up, down-up, down-up, ...) from carbon to iron, demonstrating that heavy elements (between C and Fe) were made in Red Giants via Helium-capture - because Helium adds 2 protons, increasing the element number by 2. The odd elements (less abundant) are made by radioactive decay by some of the even-numbered elements.
Elements beyond iron are made by multiple neutron capture and radioactivity during Supernova explosions.
 Check
out this panel of pretty pictures. It's useful for the quiz on "Pretty
pictures" to compare with pictures in your textbook and to find them in
my Hubble
lecture.
Check
out this panel of pretty pictures. It's useful for the quiz on "Pretty
pictures" to compare with pictures in your textbook and to find them in
my Hubble
lecture.
Check (Arny p.475; Pasachoff A-8; U of Arizona's SEDS), the Messier catalogue. Follow my directions and use your starfinder (!!!) (this is neither a lab nor is it otherwise required).
Naked eye: 8. open cluster, M45 Pleiades (Taurus - beautiful with binos), M44 Praesepe (Cancer), 7. globular cluster, don't try M15 (need binos, east of Delphinus), but M13 in Hercules on very dark nights (globulars are great in medium telescopes, especially the double cluster between Perseus and Cassiopeia (try it), and M6 & M7 in Scorpius (early fall)), 6. stellar nursery, not M16 (need binos), but M42 Orion nebula, 5. Supernova remnant, not Cygnus loop, "best" is M1 Crab in Taurus (very faint even in 8-inch telescopes), 4. naked-eye supernova: maybe in our lifetime, 3. black hole, no chance (need professional telescope), 2. galaxy, not Cartwheel, but M31 Andromeda nebula (galaxy) on dark nights, 1. planetary nebula, not Hourglass, but M57 Ring (nice "smoke-ring" in 8-inch).
Note that some objects look actually worse in telescopes.
The Andromeda galaxy for example looks beautiful on pictures (exposure
times are 30 min. and up), but bad in a telescope (your eye's "exposure"
time is 1/20 sec - remember light-gathering). You should be content
with saying "I actually saw it!" (i.e. "I saw a blotchy
object")
Messier Marathon:
The idea is to see all 109 Messier objects within one night; that's about 6 minutes to get from one to next. It's not as hard as it sounds as 6 minutes is plenty of time. One doesn't revel in their beauty (still appreciates the sights though) but needs to move on to the next one. The marathon can only be done in late March or early April on a moonless night: so that all Messier objects are in the night sky and the sky is dark enough. Again, check U of Arizona's SEDS at http://seds.lpl.arizona.edu/messier/Messier.html
I attempted my first marathon on Saturday/Sunday, April 1/2, 2000 at a spot in rural Nebraska about 10 miles north of Scottsbluff (41 degrees latitude). I had a great sky and I enjoyed it a lot! Just couldn't share the fun because I was alone. The only mistake I made was that I was wearing only thick socks and sneakers. Definitely normal socks and thick socks and felt boots. My toes were freezing all evening which I was able to forget once I scanned through the entire Virgo cluster (which was exhilarating to say the least).
I saw a total of 57 M's and 6 further NGC's: I was clouded in at midnight! Actually it was a really good opportunity to get to know the C-8 better and get to read star charts pretty good. I had all kinds of books with me but mainly used Don Machholz's Messier Marathon Observer's Guide Handbook and Atlas and Wil Tirion's Sky Atlas 2000.0. Further helpful are a Messier poster, the Audubon's field guide's photos, a Messier chart, and of course a general knowledge of the sky.
A requirement is a large aperture telescope. A 6 inch reflector or 4 inch refractor is sufficient for the experienced observer, but an 8-inch was necessary for me. A former student in Virginia was using his 10-inch, even better.
One doesn't follow the objects from M 1 to M 110 since Messier did not list them in any specific order as they are positioned in the sky. Instead, one starts with the objects that set during the twilight and soon after and then works eastward.
I followed Don Machholz's
suggestions, but as a rookie had to leave out a few objects because I couldn't
find them. My first were M 45 (Pleiades), 42 (Orion nebula), and
31 (Andromeda galaxy) with the naked eye and binoculars since they are
very easy. For everything else I used the college's 8-inch
Schmidt-Cassegrain
which I set up during twilight (that's not good enough for a head start!).
Alignment with Polaris wasn't perfect and the ground wasn't level, so I
had to adjust coordinates for the setting cirlces all night long.
That didn't prove to be a big problem though.
M 32 right next to 31
was next. Then M 52, 103, 76 (one of only two planetaries that night),
and 34 in Cassiopeia and Perseus above the NW horizon. As I tried
in vain for M33 for too long, I needed a break after that.
When I came back, I
noticed that M 79 in Lepus was too low on the SW horizon. Then M
42, 43 & 78 in Orion. The latter was quite a challenge: it's
a double(?) with a very faint nebulosity around it. Here and a few
other times (for some faint galaxies) I used higher power to confirm that
it indeed was resembling a nebulosity. M 1 (Crab) & 35 in Taurus
and Gemini. After searching for faint nebulosities, these open clusters
were a nice break: M 37, 36, 38 in Auriga, and in the South M 41,
93, 47, 46, 50, and 48 around Canis Major. Short break from the C-8:
with naked eye and binos M 44 (Beehive) in Cancer. And back to the
C-8: M 67 in Cancer.
Then came my first challenge:
the faint elliptical and spiral galaxies in Leo, M 95, 96, 105 (quick gaze
at NGC 3384), 65 and 66 (also NGC 3628). It worked pretty good, but
no wonder I get frustrated when I'm in my backyard just outside of town:
the city's light pollution is just too bad. Here, 10 miles north
of town, Scottbluff and Gering's lights on the southern horizon and Alliance's
in the West can be disregarded. Next I had to skip the galaxies in
Ursa Major since the C-8 was too awkward to work with, close to the zenith.
Instead a swing to the east: the spirals M 94, 63, 51 (Whirlpool) &
101 in Canes Venatici and the western side of Ursa Major. Then I
couldn't find M 102 in Draco. M 53, 64 and 3 in Coma Berenices and
Bootes.
And then, before I started
my dreaded part of the evening, I took a snack break. The Virgo galaxy
cluster lies between b
Leonis (Denebola) and Virgines. Start with b
Leonis, go East to 6 Leonis. That's where you start. And it
was a breeze! This is where I learned how to work the C-8 really
well. I found all those elliptical and spiral galaxies by moving
from one to the next because they are so close to each other (the preferred
method; it's way easier than plugging in coordinates). M 98, 99,
100, 85 (also NGC 4394). Then a pretty field with five faint galaxies,
M 84 and 86 (also NGC 4388, 4435, 4438; a total of 15-20 galaxies forming
the Makarian Chain). After that M 87, 89, 90, 88, 91, 58, 59, 60,
49, and finally 61. It was an absolutely great experience!!!!!
Then M 104 (Sombrero)
and 68 (a globular for a change) near Corvus. I had to skip M 83
in Hydra because of a tree in that direction (hey, no site is perfect).
And my last ones were the globulars M 5, 13 & 92 in Serpens and my
favorite, the planetary M 57 (Ring nebula) in Lyra. It's so pretty
that I can't pass it up, taking some extra time to use higher power.
Now it was midnight
and I could see clouds moving in. At this point I meant to pack up
anyway, drive home and search for the rest early in the morning from my
backyard. Upon arriving home, the sky was pretty much overcast.
I was excited enough about what I had seen that it wasn't too big of a
disappointment. At least I got some good rest that night as well
(boy, my legs were soar).
Once you have completed Labs K2 and F2 it may make more sense to you (unless the labs themselves confused you).
Check the 5th table in my "Stellar Evolution Appendix" (short SEA), and check (Pasachoff Fig.25-19; Arny p.409). Look at definitions and pictures of "globular" (Pasachoff p.398, Fig. 25.18, 25.23, etc.; Arny p.442/50) and "open" (Pasachoff p.409, 501; Arny p.450,319) clusters.
Our assumption is that all stars in a given (globular) cluster were born at about the same time, so they're all of the same age (thousands of siblings close of age) - for a justification read through Lab K2. We further assume that all spectral types of stars (O through M) are born - with percentage abundance close to the ones given in SEA-3. Now look at SEA-5 which tells you that the most massive "siblings" - the O and B stars - have the shortest life expectancy, but the least massive - K and M stars - live the longest.
Now turn your attention to (Pasachoff, Fig.25.19; Arny p.409; Snow and again (Snow's Universe is temporarily offline)).
Let me choose M11 (the "Wild Duck Cluster" in Scutum, see Pasachoff A-8;U of A's SEDS M11) - 400 stars have been measured so far (app. mag. & temp.), it's at a distance of 5500 ly and is ""500 million years old"" . I looked this up in the classic Burnham's Handbook of Celestial Objects. That age means (check SEA-5) that there are no O and B stars in this cluster anymore (they died long ago), that A0 stars are starting to die right now and that all other stars (A5 through M) are still living. -->> This means that we find Main Sequence stars of spectral types A5 through M on the HR-diagram, but no hotter ones (O, B, barely A0). NOW check (Pasachoff Fig.25-19) again: M11's turn-off point is at exactly spectral type A0.
Another example: I choose M67 (in Cancer; U of A's SEDS M67) -- notice that (Pasachoff Fig. 25.19(B)) should not say M67 in the bottom diagram. Its turn-off point lies between F0 and G0. Checking SEA-5 tells us that it should be about 4 billion years old. Why? Because the massive stars of spectral types O through F0 have died, F5 is just about to die, and G0 through M are still on the Main Sequence. -- I checked Burnham and it gives the age at 10 billion years (probably taking G0 as the turn-off), and a distance of 2500 ly with 500 stars in it.
So the further down the turn-off point of a star cluster is, the older it is.
Now you give it a try with NGC2362 and NGC188.
Also, try to plot M44 (Praesepe or "Beehive", in Cancer) with d=525 ly, about 200 stars, and age=400 mill. years; and M13 (in Hercules) with d=25,000 ly (!!), 30,000 stars counted but contains an estimated 1 million stars (!!), and age=10 bill. years (!!).
Some more questions that you may have: (1) How do we know how long stars live? (2) How do we know that a cluster's particular HR-diagram looks just like it's diagramed in (Pasachoff Fig.25-19; Arny p.409)? (3) What happens to the hot, massive star as they're dying? Why aren't they on the MS anymore? (4) What confirms these assumptions on age, life expectancy and same time of birth?
Answers: (1) Measuring the luminosity (brightness) of a star tells us
how much energy (via nuclear fusion) it MUST produce to sustain that luminosity.
Knowing the details of nuclear fusion (e.g. required core density and temperature,
and E=mc^2) and the star's mass (first from binary stars, then matching
that with spectral type) leads one to an estimate of how much Hydrogen
(the star's "fuel") is available. Comparing stars on the MS tells
us that luminosity stays about constant, no matter how old a star is.
So constant luminosity and the amount of fuel available gives us - bingo
- a star's life expectancy. -- An analogy would be to calculate your
car's range (a few 100 miles), when you know how much fuel you have and
how much fuel it consumes. (2) That's exactly what you do in Labs
K2 and F2,
also check (Pasachoff Fig.25-22; Arny p.409): M3 (in
Canes Venatici) contains 500,000 stars of which 45,000 have been measured
(spectral type or B-V, and brightness). And it's these stars that
are plotted - giving a distinct pattern on the HR-diagram. The same
has been done for all clusters - plotting all stars - and every time it
gives a distinct pattern for that cluster. (3) They have exhausted
their Hydrogen fuel, thereby cooling off and somewhat increasing in size
- i.e. moving to the bright but cold region of the HR-diagram - to the
Red Giants. So in old clusters we find these formerly hot MS stars,
that are now dying, in the upper right part of the HR-diagram. (4)
These are confirmed by the very - or simple - notion that explanations
(theories) on stellar structure fit observations so well. E.g. the
temperature-mass-luminosity relationships have been determined by lots
of (close) binary stars; the life-expectancy computer calculations (of
nuclear fusion) are confirmed by the appearance of cluster HR-diagrams.
To view deep sky objects by an amateur astronomer: (M13 is a globular cluster)
Info on clusters: (Snow Fig.15.12-14) (Snow's Universe is temporarily offline)
Use this as a jumping board to star cluster websites (Snow's Universe is temporarily offline).
Look at the Evolution of star clusters at the University of Oregon.
re: Mini Lecture 6 - Age of star clusters
>So star clusters are not all the same type and we determine the age of the clusters by which stars have died and which are still alive? If that is right, I'm sorry I asked such a simple question. I was making it a lot more complicated.
Yes, we look at which spectral type of stars has died last and that gives us the age. Yes, their HR-diagrams show at least the lower MS, but then branch off at different turn-off points.
I'm glad you asked the question, gave me the opportunity to say something
about star clusters (Pasachoff doesn't do enough). Gave me a headache
too from sitting in front of the PC for so long.
Thanks to everybody that you were able to do labs K2 and F2 and I'm glad that you enjoyed the CLEA software. I was worried that it really could lead to frustration, but it worked out much better than I could anticipate!
The main objective for you was to do some evaluation techniques on "real" observations (of course it was simulated - but you used the true data and spectra), to get an idea what's involved in doing research and to analyze data correctly. Just as looking at Saturn through binos or a telescope proves to everybody that the rings REALLY exist, this exercise shows you that scientists don't make up data and explanations, but that recorded data are diligently analyzed through hard work (your hard work in this case).
The following is from Karen (with my answers):
>First of all I did understand how to plot the stars onto the HR diagram with the B-V color index (-0.06 for Merope) on the x axis and the apparent magnitude (4.3 for Merope) on the y axis. I did this for all the stars that were posted by all the students (Alcyone, Merope, Atlas, HD23791, Pleione, and HD 23061). This made sense and I could see how all the stars were falling into the Main Sequence.
CORRECT.
>Next I played around with the formula in question 2 on how to find the distance. Formulas usually confuse me. I decided the difference of 6 magnitudes should be plugged
HOW DID YOU DECIDE? Using the procedure I described? 6 mag is correct.
>into the equation so 10^(V-M/5) would be 100(6/5) which would be 100 X 1.2 = 120.
YEP, THAT'S WRONG. It says 10^(6/5) = 10^1.2 (10 "to the power" 1.2) = 15.85
>I didn't know what to do with the d = 32.6 ly*. Brenda told me ly is light years (before I started working on it) but I didn't know what to do with the *. If you multiply 32.6 X 120 it equals 3912. I decided maybe I'm doing something wrong so that I'm off a decimal place and the answer should be 391.2 light years.
YOUR ANSWER IN FACT IS 3912 (using the formula incorrectly). That this looks like the accepted 390 ly for the Pleiades (except for the decimal place) is - believe it or not - MERE coincidence.
>That would be close to 400 light years. Of course it's most likely I don't have a clue what I'm doing and I'm way off????
USING THE FORMULA CORRECTLY GIVES 516 LY, which is certainly close to the accepted value, considering that we estimate and your measurements aren't perfect.
>On question 4, I understand that as many stars as possible should be plotted onto an HR diagram (like we did) so that it can be determined where the cluster starts to drop off the main sequence, and that Pleiades is so young that it hasn't started to drop off yet. None of the stars are old enough to be dead or dying. So using Alcyone, which is the brightest, hottest star I tried to determine the age. Using your SEA5 and Alcyone is a B8 star, I figured the age of the cluster must be approximately 350 Million years old (somewhere between A0 and B5) but I guess that's wrong because you said the accepted value is 50-100 million years. So I'm confused on this one too.
IT'S NOT THAT WRONG. The youngest open cluster known is about 10 million years, the oldest globular cluster about 13 BILLION years. So by having a range of 10 to 13,000 million years, to get anywhere from 100 to 400 million instead of 20 million (the true accepted value!) isn't terribly off.
My assumptions for this discrepancy are: there are only 500 stars in the Pleiades and stars more massive than B5 NEVER formed, which of course makes the cluster look older than it is. In this case, a more detailed analysis of the spectral lines probably tells experts (in the field of stellar evolution) that even the hottest stars (Alcyone, Electra, etc.) are not very old either.
Also, by comparing the B-V values to SEA-6, you'll notice that the least massive stars plotted are K stars. The software perhaps doesn't include M stars because they'd be too faint to analyze. Also, check SEA-5 and you'll see that K0 up to M0 stars need at least 10 million years to form (and get to the Main Sequence).
Furthermore, I just read in another book that there are a few T Tauri
stars (see Pasachoff, p.422; Arny p.393; they're low-mass
stars that are still being born) in the Pleiades, also meaning that the
Pleiades are very young.
 I
think it's a very beautiful HR-diagram because it's, in a certain sense,
probably the most accurate one ever produced. That's because the
100,000+ stars (all close ones (using parallax) up to about 13th (apparent)
magnitude) on it have their distances measured with a better than 1% accuracy,
i.e. their absolute magnitude is also determined with 1% accuracy.
I
think it's a very beautiful HR-diagram because it's, in a certain sense,
probably the most accurate one ever produced. That's because the
100,000+ stars (all close ones (using parallax) up to about 13th (apparent)
magnitude) on it have their distances measured with a better than 1% accuracy,
i.e. their absolute magnitude is also determined with 1% accuracy.
But what it's lacking are lots and lots and lots and lots of cool (and thus dim), red K and M Main Sequence stars. Hipparcos didn't measure most of them because they were too dim for its instruments. So from this viewpoint it's a pretty inaccurate HR-diagram: check my SEA-3 to see that by not including these dim K and M stars, for the 100,000 stars that are plotted there are just about 900,000 stars in the lower right hand corner missing!
Check out Hipparcos
pinpoints the stars.
Mini Lecture 9 - Spectral lines: first surface temperature, then composition
You need: my "Measuring Stars" script, the "matter and light" chapter (usually ch.3) in your textbook, especially the discussion about the spectral lines of the hydrogen atom.
Electrons jumping from a higher to a lower level, thus losing energy -> emission lines. E.g. hydrogen: 3->2 red, 4->2 blue, 5,6,7->2 all purple, etc.
Electrons jumping from a lower to a higher level, thus gaining energy -> absorption lines. They must absorb energy to jump to a higher level, thus the photon of the right wavelength must be absorbed.
See Snow Fig. 6.15 (Snow's Universe is temporarily offline). See Herter at Cornell.
The surface temperature of a star involves two principles that are important: the excitation of an atom and its ionization.

Now look at the above diagram (adapted from Carroll &
Ostlie's Modern Astrophysics, ch.8): in order to absorb certain
wavelengths, the atom has to be at the right temperature.
Diagram (b) in the middle: in the
case of the above atom (Hydrogen is always the one depicted
because it's such a simple atom), the most suitable temperature
to absorb the visible red, turquoise and purple wavelengths is 10,000 K.
To do that it must be warm enough to raise the electron to the second level
where it can absorb visible photons.
Diagram (a): it's not hot enough and the
electron is stuck in the first level so that only UV wavelengths could
be absorbed at this level (it takes more photon energy to
make an electron jump up from the first level as compared to the second
or any higher level), but stars are very cool and don't emit little
UV to begin with. Our Sun's surface temperature is about 6,000 K
where the electrons of a sizable amount of Hydrogen atoms are on the second
level: since 6,000 K < 9,000 K, our Sun's spectrum shows rather weak
H absorption lines.
Diagram (c): the star is so hot that the
electron is removed from the atom (ionization), so there is no way for
the electron to jump, thus absorption cannot occur.
 In
summary, the occurrence and strength of spectral lines is mostly
temperature sensitive. On the other hand, the abundance of an
element in a star's atmosphere is only secondary in producing spectral
lines. Keep in mind that ALL stars are made up by about 90% Hydrogen,
yet the cold and hot stars CANNOT show Hydrogen absorption lines because
the temperature is not right.
In
summary, the occurrence and strength of spectral lines is mostly
temperature sensitive. On the other hand, the abundance of an
element in a star's atmosphere is only secondary in producing spectral
lines. Keep in mind that ALL stars are made up by about 90% Hydrogen,
yet the cold and hot stars CANNOT show Hydrogen absorption lines because
the temperature is not right.
The equations above diagrams (a), (b) and (c) are the
Boltzmann and Saha equations that govern excitation (finding
an electron in a higher orbit) and ionization (removing
an electron from the atom). The g's, c's and E's are constant,
but somewhat different for each element. More important is the temperature
dependency of #N of excited atoms and #N of ionized atoms. Due to
Boltzmann, very few atoms are excited at low temperature (bad
for Hydrogen absorption lines which need the electron in the second orbit),
but more at high temperature. Due to Saha, almost none are ionized
at low temperature, but almost all at high temperature. Since both
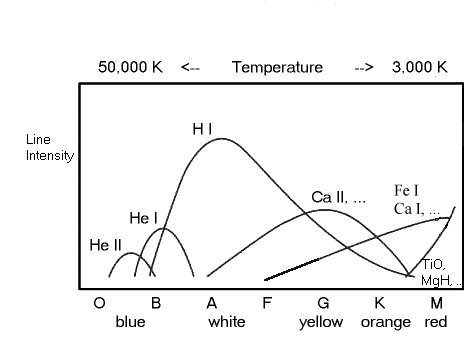
equations must be applied to the atoms, together they yield the Line
Intensity diagram: there is a clear temperature range for each element
where it will show absorption lines. Is the temperature too high
-> due to Saha too much ionization (left of all curves).
Is the temperature too low -> due to Boltzmann perhaps not enough electrons
in a required orbit (right of most curves), or due
to Saha not enough ionized atoms as necessary (right of He
II and Ca II curves).
 To
determine composition,
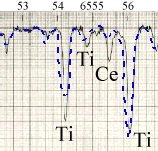
one has to look very carefully at the spectral lines. (The
overlay on the high resolution spectrum on the right was determined
by a computer model. The lines showing up are Titanium and Cerium
which tell us temperature. Only the computer model can tell us how
much of each element is in this star.)
To
determine composition,
one has to look very carefully at the spectral lines. (The
overlay on the high resolution spectrum on the right was determined
by a computer model. The lines showing up are Titanium and Cerium
which tell us temperature. Only the computer model can tell us how
much of each element is in this star.)
![]()
An example that shows why temperature, but not the abundance of an
element, is responsible for the strengths of spectral lines: this
spectrum of our Sun, a G2 main sequence star with T = 5800
K , shows Hydrogen lines of medium strength in the red, the far green (turquoise),
and two in the purple region. And there is a strong Calcium II doublet
in the far purple. This is despite the fact that the H to Ca ratio
is 500,000 to 1 (check SEA-7)!
Computations aren't shown here (see Carroll & Ostlie's
Modern
Astrophysics, Example 8.4), but plugging numbers for Hydrogen
and Calcium II (II means that one electron is removed)
into the Boltzmann and Saha equations yields that almost all Hydrogen is
neutral (required for visible H lines) and almost
all Calcium is singly ionized (required for the purple Ca
II lines). So the ratio is still 500,000 to 1. But since
the temperature is quite below the most effective 10,000 K, Boltzmann yields
that only a very small percentage of Hydrogen atoms' electrons are in second
orbit (not good for really strong visible H lines)
while almost all Ca II atoms are in the lowest energy state (good
for purple Ca II lines). This tilts the ratio towards 400
to 1 in favor of Ca II over H.
And that's why temperature is the one property that mainly affects the occurrence and strength of spectral lines.
To my WNCC Astronomy home
page.