Disclaimer: links to web sites are ever-changing.
It turns out to be a Sisyphus task to keep them updated all the time.
Therefore, either try a different "spelling" of the hyperlink, look for
it on google.com and/or let me know about an outdated link by writing an
e-mail to aveh@wncc.net .
Check
out Snow's Universe with all its Sun links (temporarely
offline) and Strobel's
great lectures on our Sun.
Our
Star - The
Sun (at
SoHO)
- Greek: Helios
Let's
take a multimedia tour first.
Well,
although I can read some Dutch, let's try it in English.
Our
Sun is an ordinary star! It's much _________ than all other stars,
therefore we call it Sun.
Note that qualitatively all stars behave the same as our Sun does
- with differences in detail.
Data we can easily measure or compute (from easily measured data): distance
Earth-Sun, size, mass, average density, luminosity of Sun.
The DISTANCE to our Sun can be measured via two different ways
(which is great because one can confirm the other):
1. Parallax: of course we can't take the Earth's orbit as our baseline
(why not?), but the Earth's diameter (12,800 km) will do. Two people
at opposite sides of the Earths (12,800 km distant from each other) eye
our Sun and make very accurate position measurements. Their combined
data give a parallax/triangulation of a very small (but measurable!) 0.005
degrees. Given the 12,800 km baseline, this gives a distance of a
= 12,800 [km] / 0.005 * 360 / 2 p
= 150 million km, defined as 1 A.U.
2. Radar: a radar beam (at speed c = 300,000 km/s) sent out on
Earth towards our Sun is reflected off our Sun and returns after 17 min.
Since this is forth and back, one way is 8.5 min. And since distance
is speed times time, a = 300,000 [km/s] *
8.5 * 60 [sec] = 150 million km == 1 A.U.
=
93 million miles. Voila!
Its size (DIAMETER) is determined from its apparent size of
0.5 degrees (a pinkie (but use your thumb to be on the safe
side) at arm's length covers our Sun - as well as our Moon) and
the distance.
d = 0.5 / 360 * 2 p
*150,000,000 [km] = 1.3 million km = 800,000 miles.
Our Sun's MASS is determined by Kepler's 3rd law: we saw the
period-distance relationship of planets and noted that this depends on
the mass of the central object (see lab F9
and lecture on Gravitation). Our Sun's
mass is 1 solar Mass M = 4 p2
/ G * a3 / P2 = 2.0
1030 kg . (G is the gravitational constant, for a
(in meters!) and P (in seconds!) you can use any planet's data.)
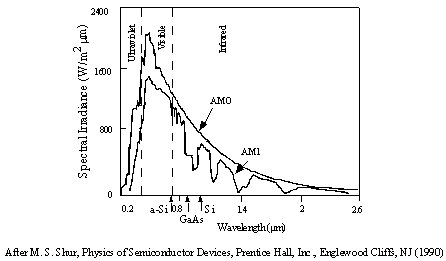
Solar
constant (energy received from sun on Earth - measured on Earth
and with satellites): 1,370 Watts/m² . Since the Earth intercepts
only a small part of our Sun's radiation and since our Sun's radiation
is isotropic (the same in all directions), we multiply this number by the
area of a hypothetical sphere of radius 1 A.U. = 150 million km = 1.5
1011 m (Area = 4 p r2),
which then gives us the total energy that our Sun gives off per second:
3.9 1026 Watts (1 Watt = 1 Joule per second), which we also
call its Luminosity:
1 solar L = 3.9 1026 W.
Compare: All nations in the world together use about 1022
Joules per year. For how many years would our Sun's energy emitted in a
single second last, if we could harvest it completely?
_____________________ - of course, we can't harvest all the Sun's
energy, just a small part of what reaches Earth.
What generates this huge amount of energy?
Guesses: ...
elves and dwarfs treading the mill
...
...
...
...
Model of our Sun
Sun's
composition by # atoms (and by mass):
92%
Hydrogen (73% by mass), 7% Helium
(25% by mass), all others less than 1% "metals"
(2% by mass). Note that Helium is 4 times
as massive as Hydrogen, hence the numbers for abundance and mass are different.
Interesting is also that almost ALL stars (99%
of them) have about the same amount of H and He as our Sun does,
and so does the Interstellar Medium! (see lectures on Measuring
Stars and Stellar Evolution)

Sun is
in balance
Gravitation: Sun's own mass pulls itself inwards
-> matter is compressed
-> creating high temperature and pressure
-> which pushes outwards and balances gravitation
-> hydrostatic equilibrium
- otherwise our Sun would contract or expand, which
it doesn't
Energy given off is constant
-> energy supplied at a constant rate (due to nuclear fusion)
-> i.e. as much energy is produced as is given off
-> thermal equilibrium
- otherwise our Sun would get brighter and hotter
or dimmer and colder, which it doesn't
Nuclear
fusion

|

|
| Two protons at a time fuse ... |
... into a deuteron, emitting a positron and a neutrino. |

|

|
| The deuteron and another proton fuse ... |
... into Helium-3, emitting photons. |
 |
 |
| Two Helium-3 fuse ... |
... into Helium-4, emitting two protons. |

The proton-proton cycle. Image "List-O-Particles"
(c) ZEBU, Oregon. (Remember that a proton is simply
the nucleus of a Hydrogen atom (with the electron removed).)
The fifth step, where two He-3 fuse, requires that the first four steps
happen twice (in order to produce two He-3). So by counting all protons
involved (a total of six, but two are re-emitted at the end), this leads
to a net equation of 4 p -> He-4 &
2 e+ & Energy . The emitted photons
(nuclear fusion produces g rays) and the additional
radiation due to the core's 15 million K temperature is what eventually
reaches us as EM radiation (see discussion below). Oregon's
Zebu shows the processes really well in its animations.
More massive Main Sequence, Population I (with enough metals), stars
(spectral types O, B, A, F) have higher core temperatures (see SEA-5)
and use the CNO cycle, but yield the same net equation.
The above processes occur 1037 times every single second
(see below)!!!!
Sun's core
-> temperature (15 million K) and pressure (200 billion atm) high enough
-> to overcome the electric repulsion of the positive protons
-> to ignite nuclear fusion
and density of Hydrogen high enough (about 20 times that of iron)
-> to keep nuclear fusion going
ZEBU-Oregon's
mpeg-movies on nuclear fusion
Hydrogen nuclei (protons) fuse into Helium and give off energy in form
of g rays (see Chaisson p.270
and p.275, qu.18). Does it generate enough energy for the sun to
give off the above mentioned 390,000,000,000,000,000,000,000,000 Watts?
You bet.
Shall we calculate and confirm it?
-
Yes (let's have it as a problem on the final).
-
No (let's omit it and believe that astronomers can do easy calculations).
In a nutshell:
mass of proton is 1.67 10-27
kg = 1.0078 amu. (The "atomic mass unit" is more convenient.)
Four protons make a mass of 4.0312 amu ("input
mass"). This compares to the He-4 with 4.0026
amu and the 2 positrons of 0.00055 amu each, making a total of 4.0037 amu
("output mass"). So after
the reaction, there is less mass than there was before!!! Where did
this mass deficit Dm=0.0285 amu go? The
most famous formula in the world supplies the answer: E = Dm
c2 ! Since the
speed of light c=3.0 108
m/s is so large, this gives an energy of 4.3 10-12
Joules per reaction (back from amu to kg).
With a luminosity
of L=3.9 1026 J/s,
this means that the tremendous amount of 9.0 1037
He-4 nuclei are produced every second (and 3.6 1038
protons fuse each second). That's a 9 with 37 zeroes! That's
a huge number of reactions required - but compare this to the number of
Hydrogen nuclei (protons) available: # p ~ (total mass of Sun) /
(mass of proton) ~ 2.0 1030
kg / 1.67 10-27 kg
~ 1.0 1057 , a "One"
with 57 zeroes!
Computer simulations
show that our Sun used/uses/will use about 10% of its total Hydrogen supply
(the Hydrogen in and around the core where it's hot enough for nuclear
fusion). Given that the luminosity is fairly constant (again, computer
simulations) throughout our Sun's Main Sequence life, this means that the
lifetime of our Sun is t = (total Energy available)
/ Luminosity = (0.1 [%] * 2.0 1030
[kg] * 0.0285 [amu] / 4 [p] *
(3.0 108 [m/s])2
) / 3.9 1026 [J/s]
= 3.3 1017 [sec] =
10 billion years
Now, this wasn't too hard after all - Intermediate Algebra,
a scientific calculator and straightforward computations was all we needed.
Well, let's get bombarded by g rays.
Do we get them?
If not, what happens?
Energy transfer
A pot of boiling water on a stove is a good example of all three possible
ways by which energy can be transported. Touch the outside of the
pot - that's conduction. Watch the water bubbles rising from the
bottom of the pot to the surface - that's convection. Lift the pot
off the burner, the flame or the glowing heating coil - that's radiation.
Energy can be transported by 3 different means:
-
Conduction - primarily in solids
-
Convection - in liquids, gases, plasma (which is gases where atoms are
stripped off their electrons)
-
Radiation - photons; liquids, gases, plasma, solids, vacuum - anywhere
Our Sun is made out of gas which, strictly speaking, can behave as a liquid
as well. So conduction is ruled out as a means of energy flow, but
energy is transported via convection and radiation inside our Sun.
From core, radiation (g rays) gets into thick
sun's interior
-> g rays absorbed
-> radiation re-emitted in all parts of the EM-spectrum
-> after 100,000 years energy reaches convection zone
In the convection zone, hot gases
rise to the photosphere, cooled off gases sink back (observed granules),
check Snow
(temporarely offline).
 From
the photosphere, energy is emitted as black
body radiation into space.
From
the photosphere, energy is emitted as black
body radiation into space.
In the upper photosphere, certain wavelengths (for each element;
recall
the chapter on radiation and lab
F5) are absorbed, which gives rise to the sun's absorption spectrum
(Chaisson
p.260).
Check your textbook's index under "Sun" (or other books written
on our Sun): It covers almost an entire column with catchwords like color,
composition, density, energy transport, lifetime, magnetic field, temperature,
rotation, etc., etc. How do we know all of this? _________________________________
Sun's surface
 Granules
are rising (hot, bright) and sinking (cooler, dark) convection cells.
Granules
are rising (hot, bright) and sinking (cooler, dark) convection cells.
-> entire surface is covered with them (Chaisson p.258).
(c) Kiepenheuer
Institut für Sonnenphysik, Freiburg, Germany.
The picture is about 25,000 miles vertical and horizontal, about 0.02
% of the Sun's surface. Of course the most prominent feature in this
image is a sunspot about as big as Earth. But granules are the texture
covering the entire area, they have an average diameter of 500 miles.
Prominences are caused by magnetic instabilities near sunspot groups.
Hot ionized gas follows the magnetic field lines between magnetically opposite
sunspot poles.
(c) High Altitude Observatory Archive
This prominence, photographed in 1946 in Ha
light, arcs about 100,000 miles high into space. Earth fits many
times into the space between the arching surface of our Sun and the lower
part of the spiraling prominence.
Sunspots: Our Sun is a liquid/gaseous body

 ->
it rotates at different rates at different latitudes (29 days at equator,
24 days near poles)
->
it rotates at different rates at different latitudes (29 days at equator,
24 days near poles)
-> this "differential" (i.e. non uniform) rotation disturbs (wraps)
the magnetic field lines
-> producing sunspot pairs (one North, one South polarity)
-> lifetime: hours (small ones) to weeks (large ones)
-> since they stay in the same position
-> observing them over several days reveals how fast the sun rotates
-> my Lab G0 Sunspots and Sun's
rotation
-> SoHO: Observe the
motions of sunspots
and use them to measure the solar
rotation rate, also at the University
of Montana, at Stanford,
and a movie
of the giant sunspot from March/April 2001.
and Sun's magnetic field reverses every 11 years (North pole becomes
South pole),
actually a 22 year cycle (when the North pole becomes again a North
pole).
-> during reversing, magnetic field becomes weak
-> few sunspots, minimum (last one in 1995)
-> next maximum around 2000 (see Chaisson p.265)
Short-wave and HAM radio enthusiasts like sunspot maxima because the
increased solar activity makes reception of far away stations much clearer.
People in Quebec sure didn't like the power outage during the last sunspot
maximum in 1989 (Quebec is closest to the Earth's Northern magnetic pole).
You may want to look for yourself for the causal connection between
increased solar activity and its influence upon the Earth's atmosphere.
Solar Atmosphere
-
Photosphere
-
- emits the energy that reaches us (Planck's law)
- absorption spectrum (Fraunhofer; spectral type G2)
- maximum in yellow part of spectrum
-> surface temperature at 5,800 K ( __________ law)
To confirm this surface temperature, use the Stefan-Boltzmann
law L = 4 p s r2
T4 and
solve for temperature: T = ( 3.9 1026
/ 4 p
/ 5.67 10-8
/ (6.5 108 m)2
) .25 = 6,000 K
.
-
Chromosphere
-
- chromo means color
- pinkish color (due to Hydrogen emission lines)
- thin layer of hydrogen above photosphere
-> cooler and much fainter than photosphere
- visible during solar eclipses and through filters (Hydrogen Ha
and Calcium H and K lines)
-
 Solar
Eclipse in the Caribbean. (c) Jamalee and Dan Clark, Scottsbluff,
NE. February 26, 1997.
Solar
Eclipse in the Caribbean. (c) Jamalee and Dan Clark, Scottsbluff,
NE. February 26, 1997.
-
Corona
-
- high temperature (up to 2 million K)
-> many electrons stripped off from their atoms
-> unusual spectra (e.g. 13 times ionized Iron)
-
- visible during solar eclipses as huge
extensions of the sun's atmosphere into space
 Solar
wind
Solar
wind
- Sun expels protons, electrons at high speeds
-> when reaching earth caught by our magnetic field
-> spiraling around magnetic field lines (see this
animation)
-> hitting the Earth's atmosphere at the poles
-> _________________ (Ch/Mc p.133)
 Aurora
in Scottsbluff, NE, (houses on the lower right, a couple of stars on the
right - also, it was cloudy that evening). (c) Andreas Veh, September
1998. This was my first Aurora. I saw vertical, hazy, whitish
streaks rising high from the Northern horizon and lots of flickering in
the Northeast, but no colors. Instead the film picked up the green
and red which are attributed to atmospheric Oxygen when it recombines after
being hit by solar wind particles which were funneled by the magnetic field
towards the Earth's magnetic poles. Exposures are about 1 min with
a 28 mm wide angle lens. My wife's folks in Alaska saw it the same
evening.
Aurora
in Scottsbluff, NE, (houses on the lower right, a couple of stars on the
right - also, it was cloudy that evening). (c) Andreas Veh, September
1998. This was my first Aurora. I saw vertical, hazy, whitish
streaks rising high from the Northern horizon and lots of flickering in
the Northeast, but no colors. Instead the film picked up the green
and red which are attributed to atmospheric Oxygen when it recombines after
being hit by solar wind particles which were funneled by the magnetic field
towards the Earth's magnetic poles. Exposures are about 1 min with
a 28 mm wide angle lens. My wife's folks in Alaska saw it the same
evening.

Visit Brian Rachford's Aurora
alert page for 40 degrees latitude.
Read about the 1989 power outage in Quebec in this 2000
USA Today article.
Read in your textbook what the solar wind has to do with comet tails.
Listen to the sounds
of the Aurora.
Very strong activity in Europe on April 7, 2000.
Image made by NOAA's Polar-orbiting
Operational Environmental Satellite (POES). I used a negative
representation so it would print better.
Friday, 7 April, 2000, 11:06 GMT
12:06 UK
Skywatchers marvel at light show
Diffuse red glow
Observers all over the Northern
Hemisphere were stunned by the display.
A report from Chester, UK, by Tom
Teague said that a bright diffuse red glow was visible, with many broad
rays orientated roughly north-south. Some narrower, more concentrated rays
with a greenish tinge were also seen.
Chartered engineer Ian Sheffield,
of the Royal Observatory in Edinburgh, UK, who watched the display from
his home in East Lothian, said: "It was the most amazing display I have
seen in 10 years.
"They started at 1900 GMT and they
looked like Jacob's Ladders coming down to the horizon. They were pale
green with streaks of red that was quite unusual. It was ghostly."
Veils of pale green
The Duty Controller at the Jodrell
Bank radiotelescopein Cheshire, UK, described the lights as very spectacular,
with curtains of red and green light seen between 1130 and 0200 GMT.
A report from Dave Branchett in
Florida, US, said: "These events are rare from this part of the world but
even rarer was the sight of fingers or rays that shimmered and danced within
the aurora."
Another observer said: "I've just
spent the last two hours gazing up at a sky literally on fire with swaying
red curtains and billowing veils of pale green and white streamers. Beams
are everywhere. At one point, everything merged overhead, and staring up
at it was like staring into some kind of pink wormhole - unbelievable."
Our Sun's spectrum

(Link
to my Fraunhofer spectrum page)
Also named the Fraunhofer
spectrum (Snow's web site is temporarely offline).
For two
"In 1802, William Wollaston noted that the spectrum of
sunlight did not appear to be a continuous band of colours, but rather
had a series of dark lines superimposed on it. Wollaston attributed the
lines to natural boundaries between colours. Joseph Fraunhofer made a more
careful set of observations of the solar spectrum in 1814 and found some
600 dark lines, and he specifically measured the wavelength of 324 of them.
Many of the Fraunhofer lines in the solar spectrum retain the notations
he created to designate them. In 1864, Sir William Huggins matched some
of these dark lines in spectra from other stars with terrestrial substances,
demonstrating that stars are made of the same materials of everyday material
rather than exotic substances. This paved the way for modern spectroscopy."
from Jesse
Allens' web site.
Here you can see how I assembled the entire
solar spectrum from the Observatoire
de Paris and from the McMath-Pierce
Observatory on Kitt Peak, Arizona.
A star's spectrum gives us LOTS and LOTS and LOTS and LOTS of information.
Check my lectures on Measuring Stars
and Light and Matter.
The above above spectrum gives as foremost the surface temperature of
our Sun, not its composition. Read through my lecture on Measuring
Stars first about temperature and then composition.
.......
Now you know and you're able to determine the following correctly.
Access the Observatoire
de Paris and follow my instructions.
Which of these elements' absorption lines show up fairly STRONG in our
Sun's spectrum?
instructions: make check marks for the settings "Plot
dat", "Image data"
| Element |
|
Wavelength(s) |
color |
weak or strong? |
start wavelength |
range |
| Calcium II |
Ca II |
3934 & 3968 |
UV |
_________ |
3900 |
100 |
| Sodium |
Na |
5890 & 5896 |
yellow |
_________ |
5860 |
40 |
| Helium |
He |
5870 |
yellow |
_________ |
ditto |
ditto |
| Titaniumoxide |
TiO |
6159 |
red |
_________ |
6150 |
20 |
| Hydrogen |
H |
6563 |
red |
_________ |
6560 |
10 |
| Gold |
Au |
7510.7 |
IR |
_________ |
7510 |
2 |
| Iron |
Fe |
7511.0 |
IR |
_________ |
ditto |
ditto |
There are plenty more absorption lines for each element, but I only
wanted to give you a sample.
In the above table, you should have four "yes's" and three "no's".
After you've read through the lectures that I had recommended, you should
be able to figure out why some lines show up and others don't.
Answer: _____________________________________________________________
(This is also part 1 of lab F6
Stellar Spectra.)
The absorption lines of Gold don't show up as strong lines at all in
our Sun's spectrum (there is very few Gold to begin with).
How much is "very few"? Let's estimate. First check SEA-7:
there are 7 Gold atoms for every one trillion Hydrogen atoms. This
means that roughly 7/1,000,000,000,000 = 10-11
of our Sun is Gold. Multiply that with our Sun's mass of roughly
1030 kg (or pounds).
Multiplying
like bases (base 10) means to add exponents,
so it's 1030+(-11) = 1019
kg (or pounds) of Gold on our Sun. Compare that
to the 31 million kg (70 million pounds) of Gold that
has been mined throughout the ages on Earth: Gold is 1 trillion times more
abundant on our Sun than on Earth!!!
The above calculation serves several purposes: (i) see
how exponents are added or subtracted (useful for a certain HW question),
(ii) although the amount of Gold on our Sun is so very small when compared
to other elements, because of our Sun's very huge mass, the net amount
of Gold on our Sun is mind boggling.
(A more exact mass of Gold on our Sun would be determined
by mAu = Mox
.71 x 7 x
10-12x 197 , where
Mo = 2 x
1030 kg our Sun's
mass, .71 Hydrogen's part of that mass, 7 x
10-12 is Gold's fraction
when compared to Hydrogen, and 197 is how much more massive one Gold atom
is than one Hydrogen atom. This makes for 2 x
1021 kg = 4 x
1021 pounds, which
is even a factor 400 larger than our above rough estimate.)
You have to peek into (Chaisson, ch.12 Measuring Stars)
your textbook and read this lecture carefully to answer the following Homework
questions (same questions on HW #10):
Our Sun's radius is about 450,000 miles. How do we know this?
... Sun's mass is about 2.0 1030 kg. How do we know ..?
... Sun's density is 1.4 as much as that of water. How do we ...?
... surface temperature
is 10,000 F. How do ...?
... luminosity is
3.9 1026 Watts. How ...?
... core temperature
is 24 million F. How ...?
... lifetime is estimated
at 10 billion years (of which 5 billion are still ahead of us). How
...?
What do the Northern and Southern lights have to do with our Sun? Why
do they only occur at latitudes close to the poles?
Using the Doppler shift to determine the solar rotation
(Another procedure is to use the "movement" of Sunspots,
Lab
G2 Sunspots)

The diagram shows a very narrow part (close to the red
Ha
line) of the solar spectrum. The equivalent total solar spectrum
(purple 4000 to red 7000 Å) would be 600 feet long!
The broad
absorption lines are in the red part of the spectrum, from iron on our
Sun. They have some width because our Sun is rotating: its Western
limb is rotating towards us (blueshift) and its Eastern limb is rotating
away from us (redshift). Since the entire surface is rotating, it
widens an absorption line, the more it's rotating, the more it's widened.
The thin absorption lines are from oxygen in the Earth's
atmosphere. They are the same red wavelengths that show up in photos
of Aurora Borealis. Sun and Earth's atmospheric
lines can be distinguished by the former being broadened due to our Sun's
rotation (we are rotating as well but the oxygen in the air is stationary
relative to us). These oxygen lines are of no interest in the following
analysis.
Print the above image. Carefully draw a sharp vertical line in
the middle of a solar iron line from the top to the bottom of the "trough".
Half way draw a short horizontal line that touches the "trough's" edges.
Determine the width of this absorption line, this is Dl
.
Using the Doppler equation, determine the rotational velocity of the
approaching and receding limbs of our Sun: vrot
= c (Dl) / (l)
in km/s . The speed of light is c = 3.0 105
km/s .
The period (the time it takes our Sun to rotate once) is given by
P = (2 p R) / vrot in seconds.
The solar radius is R = 6.96 105 km . Convert
period P to days by dividing by 86,400 (24*60*60).
Compare to a textbook value and to your value from Lab
G2 Sunspots.
Copyright Niel Brandt 1994. Please see the Copyright
Notice.
Sun Talk at Scotts Bluff National Monument, June 12,
2001
Need:
- laptop, projector, long internet cord
- telescopes with filters, safety features, projection screen, eclipse
glasses (no need at all, sun is way too low)
- SOHO screen saver on laptop
- various color filters to explain images taken in different parts
of the spectrum
- Redshift
